Data News — Week 52
Data News #52 — Just a big THANK YOU.

This year is for me, Christophe, a turning point in my professional life: I left my standard 9-17 job as a data engineer and started 2 projects. Data consultancy and making online content about what I’m most interested in: data. Especially data engineering, of course.
At first, I wrote the first editions of the Data News thinking that few (if any) people will find it, and read it. Surprisingly enough, having my very first subscribers motivated me to keep writing the Data News every week, without ever skipping one! And here we are today, I’m writing this article, and 616 people will receive it in their inbox.
I was quite intrigued when I started looking back at my whole year, so i took some time to analyse and understand the maths behind our Data News journey.
So here’s what happened between May 2021 and December 2021, in figures.
The newsletter
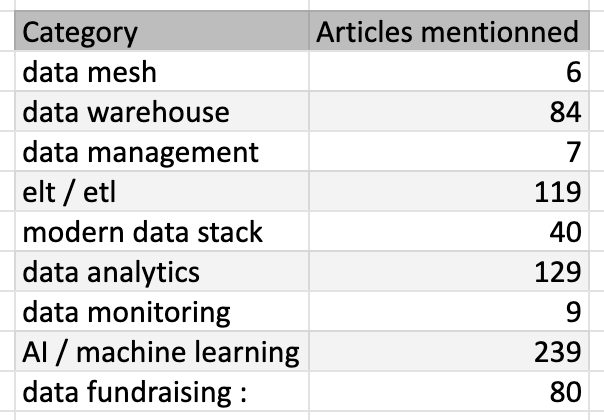
In the 33 editions of the Data News, various data topics were addressed. Recently, we tried categorizing all the articles ever mentioned on the Data News in the Data Links Explorer. We used an algorithm — that can be improve — to categorize each article into 9 categories :
- data mesh
- data warehouse
- data management
- ELT / ETL
- Modern Data Stack
- data analytics
- data monitoring
- IA / machine learning
- data fundraising
This Data Links Explorer allowed me to make some statistics about what are apparently my favourite topics to write about.
According to it, here are a table of how many articles I mentioned in each category:

Obviously and sadly — for diversity — Medium and Towards Data Science were the most frequent domains I shared in the newsletter with around 150 articles (20%). I also recently started to include dev.to and Hashnode to my sources to add diversity but also more and more independent writers.
After seeing all the topics and articles I wrote about, I wondered how much time I spent on the Data News. Since I started writing in May, I wrote a total of 29 187 words, spent a total of 165 hours writing Data News editions, yes it's more than 6 days.
With all this content on the Data News, the number of subscribers kept increasing since the beginning.
Other stats
The Data News has reached a total of 616 subscribers, growing more and more each month. Here's a quick graph to illustrate subscribers over the past months.

I also took some time to track some interactions you could have with the Data News using Plausible — I tried to keep your privacy safe.
- The most popular editions of the Data News are Week #31, Week #40 and Week #49.
- Since June we got 20k page views and the average visit duration is 2m15s.
- 1800 links have been clicked and probably visited and the top 3 is the Future of Modern Data Stack by dbt, data engineering future by Zach and data engineer roadmap.
- The average open rate of the Newsletter is 62% and around 100 subscribers have a 100% open rate.
- Only 13 people unsubscribed and according to my system 30 members never ever opened an email
Conclusion
Thank you ❤️.

This journey has just began, I want to create something I'd love to read each week so I'm happy you find the newsletter useful or just fun to read. I'll keep doing that in 2022. The biggest issue will probably be the naming because soon we'll loop over the weeks.
Also, thanks to you and thanks for your goodwill I feel more confident in writing in English — because spoiler it's not my native tongue and I was unsure at first. The main takeaway here is don't be afraid to do stuff, just do it. Especially if you think it'll be good for you.
I wish you a Happy New Year in advance and see you soon.
PS: if New Year means New Job for you here a motivational post for you.
blef.fr Newsletter
Join the newsletter to receive the latest updates in your inbox.
